
| Music Analysis | ||
|---|---|---|
| Previous | Next | |
| Context-sensitive Search | Algorithmic Composition | |
An extensive music analysis framework was developed as part of MPS, which facilitates statistical and musicological analyses.
There are a number of motivations for the development of the MPS analysis tool:
MIDI and/or MusicXML files. The system produces output files in CSV format which can be opened with any regular spreadsheet application.
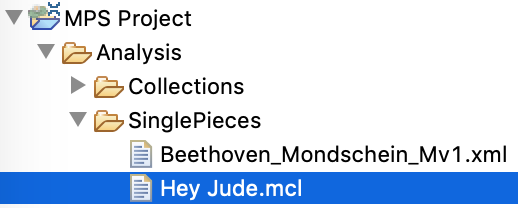
To analyze musical compositions, one or more files containing symbolic music data in MIDI or MusicXML format have to be provided. The analysis and export process is configurable. Different analysis scopes are possible. Either a single piece, a collection of pieces or a corpus of pieces can be analyzed.
The first musical analysis scope to be introduced is the single piece scope. It is used for gaining insights about a specific musical composition by performing either a global analysis or a voice-specific analysis of the piece. It is also possible to combine the aforementioned analysis modes. Furthermore musically meaningful sections can manually be marked in the score in order to perform section-wise analysis, which is optionally combinable with voice-wise analysis.
Collection analysis is suitable for comparing multiple musical pieces among each other. For this purpose, analysis results are shown next to each other in combined representations. Corpus analysis goes even one more step further, allowing to compare multiple collections of compositions, e.g. folders containing multiple compositions of individual composers.
To start analyzing music, simply select a file or folder and click the button ![]() in the toolbar. Another possibility is invoking the context menu by using a right click and choosing Run As → MPS Analysis Run. If a file or folder is analyzed for the first time, a corresponding launch configuration will be opened. Adjust the configuration as desired and then click Apply and/or Run to start the analysis process. See section Configuring Music Analysis for more details.
in the toolbar. Another possibility is invoking the context menu by using a right click and choosing Run As → MPS Analysis Run. If a file or folder is analyzed for the first time, a corresponding launch configuration will be opened. Adjust the configuration as desired and then click Apply and/or Run to start the analysis process. See section Configuring Music Analysis for more details.
The progress of the analysis process will be shown in the Progress view, which is located at the bottom of the application by default.
Folders with the name schema <analyzed file or folder>_Analysis will be created for each analyzed file or folder. The results will be stored in these folders in the form of CSV files. These contain column names in the first line/row and analysis result values in the following lines/rows.
There are multiple options for viewing and exploring analysis results. One option is to view the raw analysis data directly or in a spreadsheet editor. To view raw analysis data, follow these steps:
.csv file extension in your operating system.A more comfortable option is to use the Analysis Result Browser provided by MPS. To open it, right-click an analysis folder and and choose Open Analysis View from the context menu:
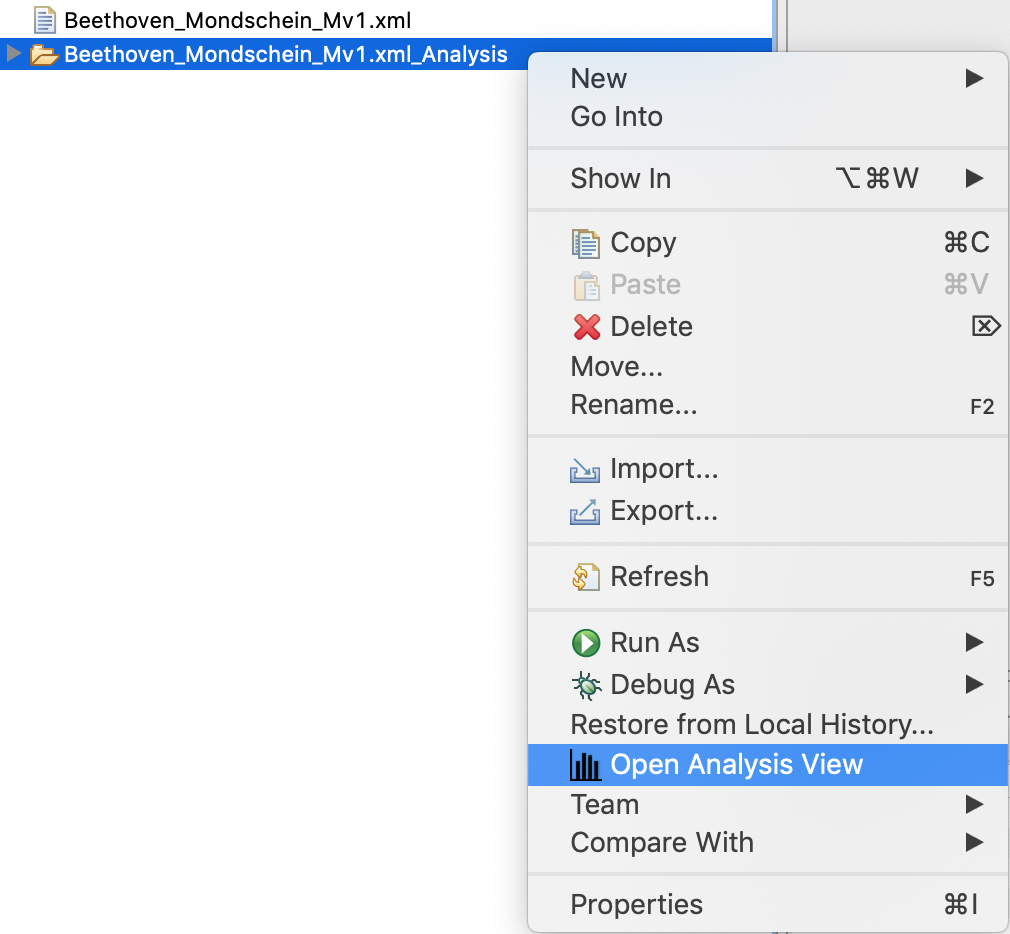
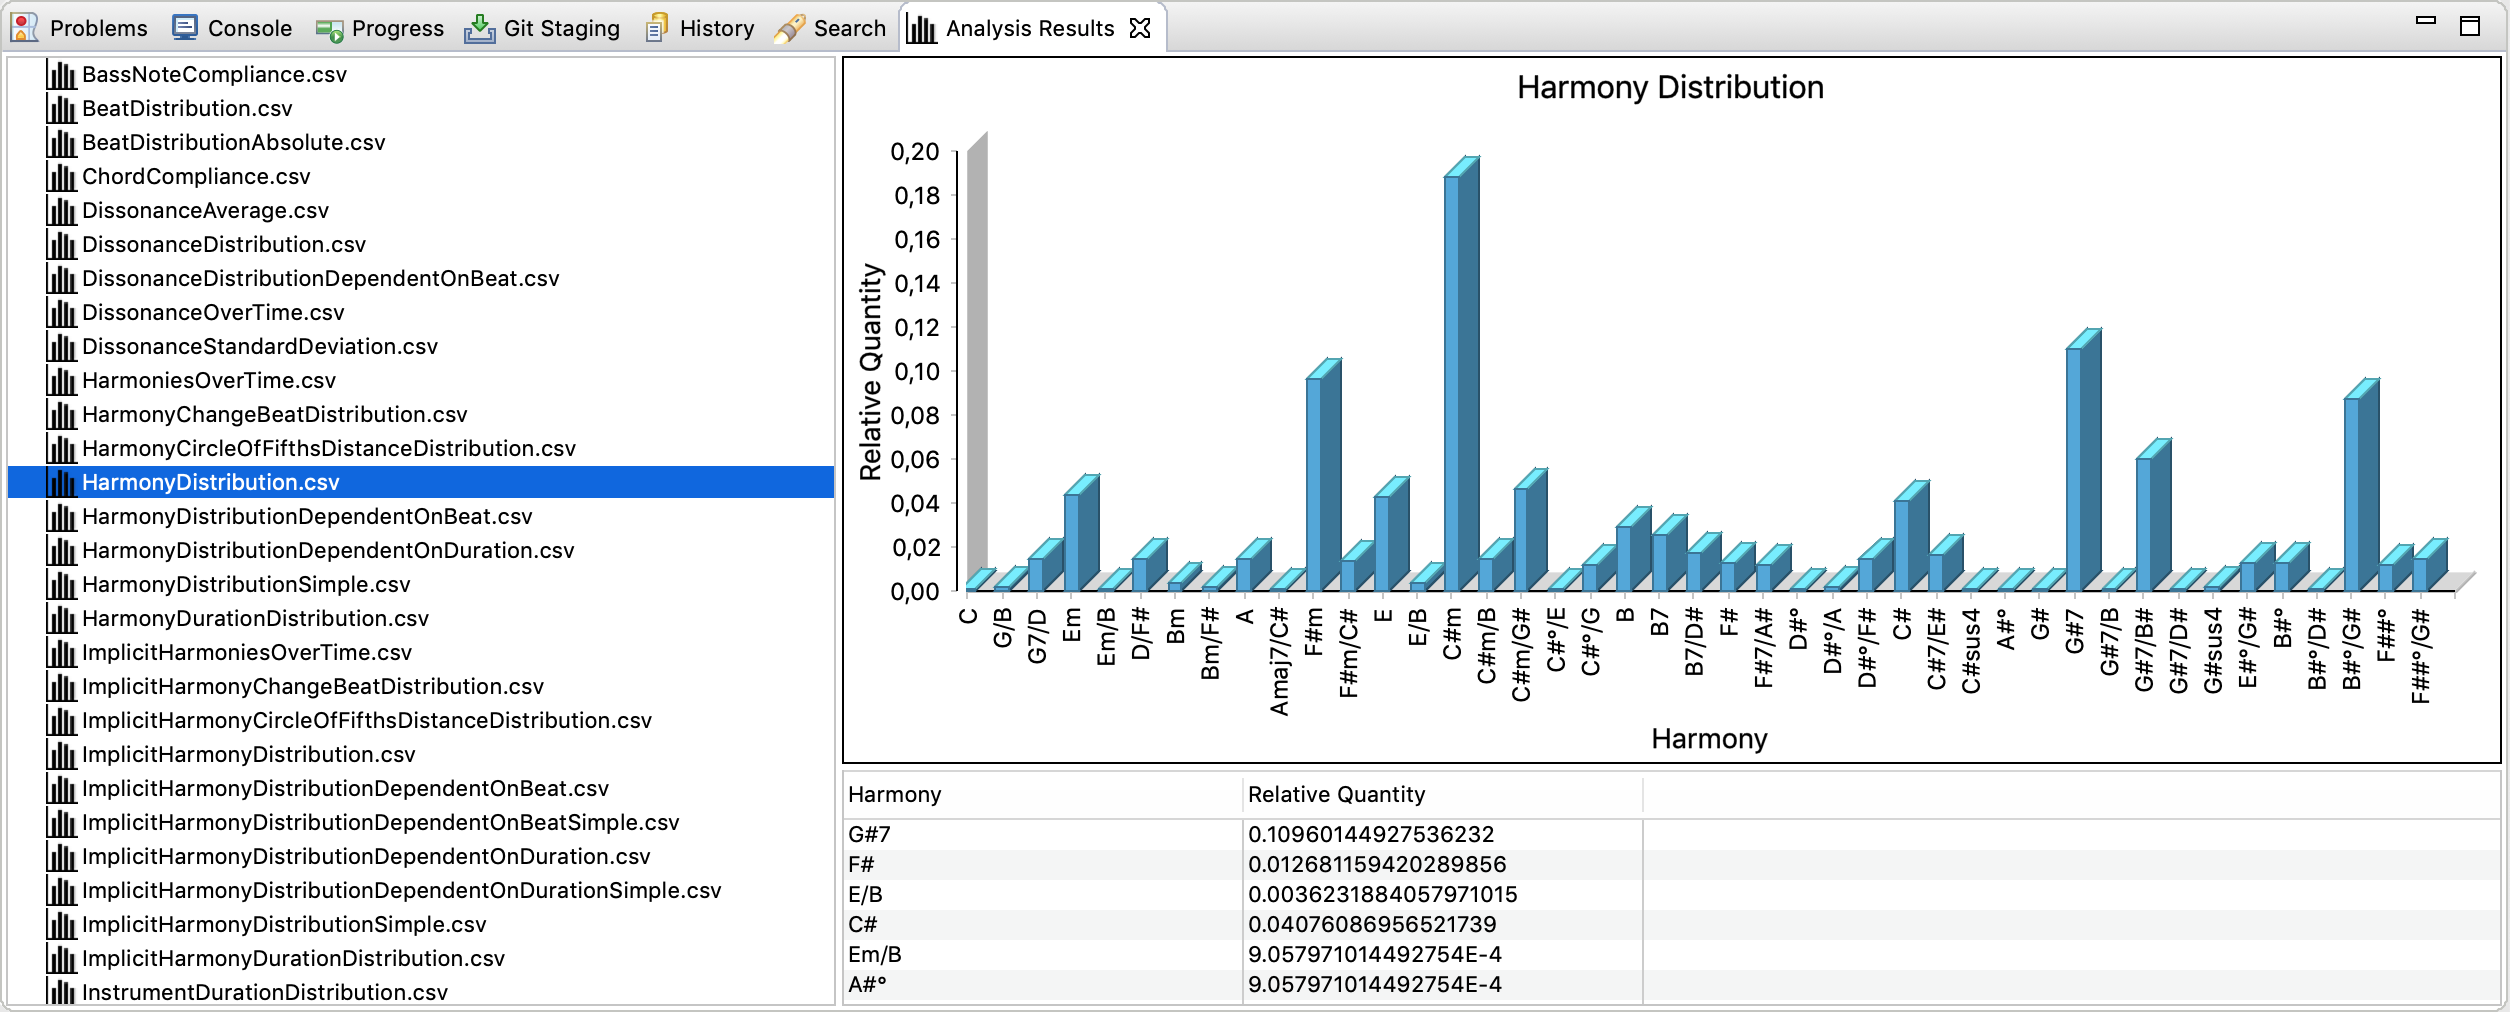
The analysis result view will be shown. To initialize the view with data, select an arbitrary folder containing analysis results. Once the view is associated with a data set, CSV files can be selected on the left hand side of the view. MPS will display the raw CSV data and a corresponding plot or graph depending on the content of the selected CSV file.
The generated charts can be exported as file. To export a chart, right-click on the graphic and select Export Chart to File. After specifying the destination, the file will be generated. Currently, the following image formats are supported:
BMPJPEGPNGThe analysis process can be configured by adjusting a so called run configuration. A run configuration is automatically created when a file or folder is initially analyzed. To change run configurations later, click the black arrow next to the button ![]() in the toolbar and click Run Configurations.... The following window will open:
in the toolbar and click Run Configurations.... The following window will open:
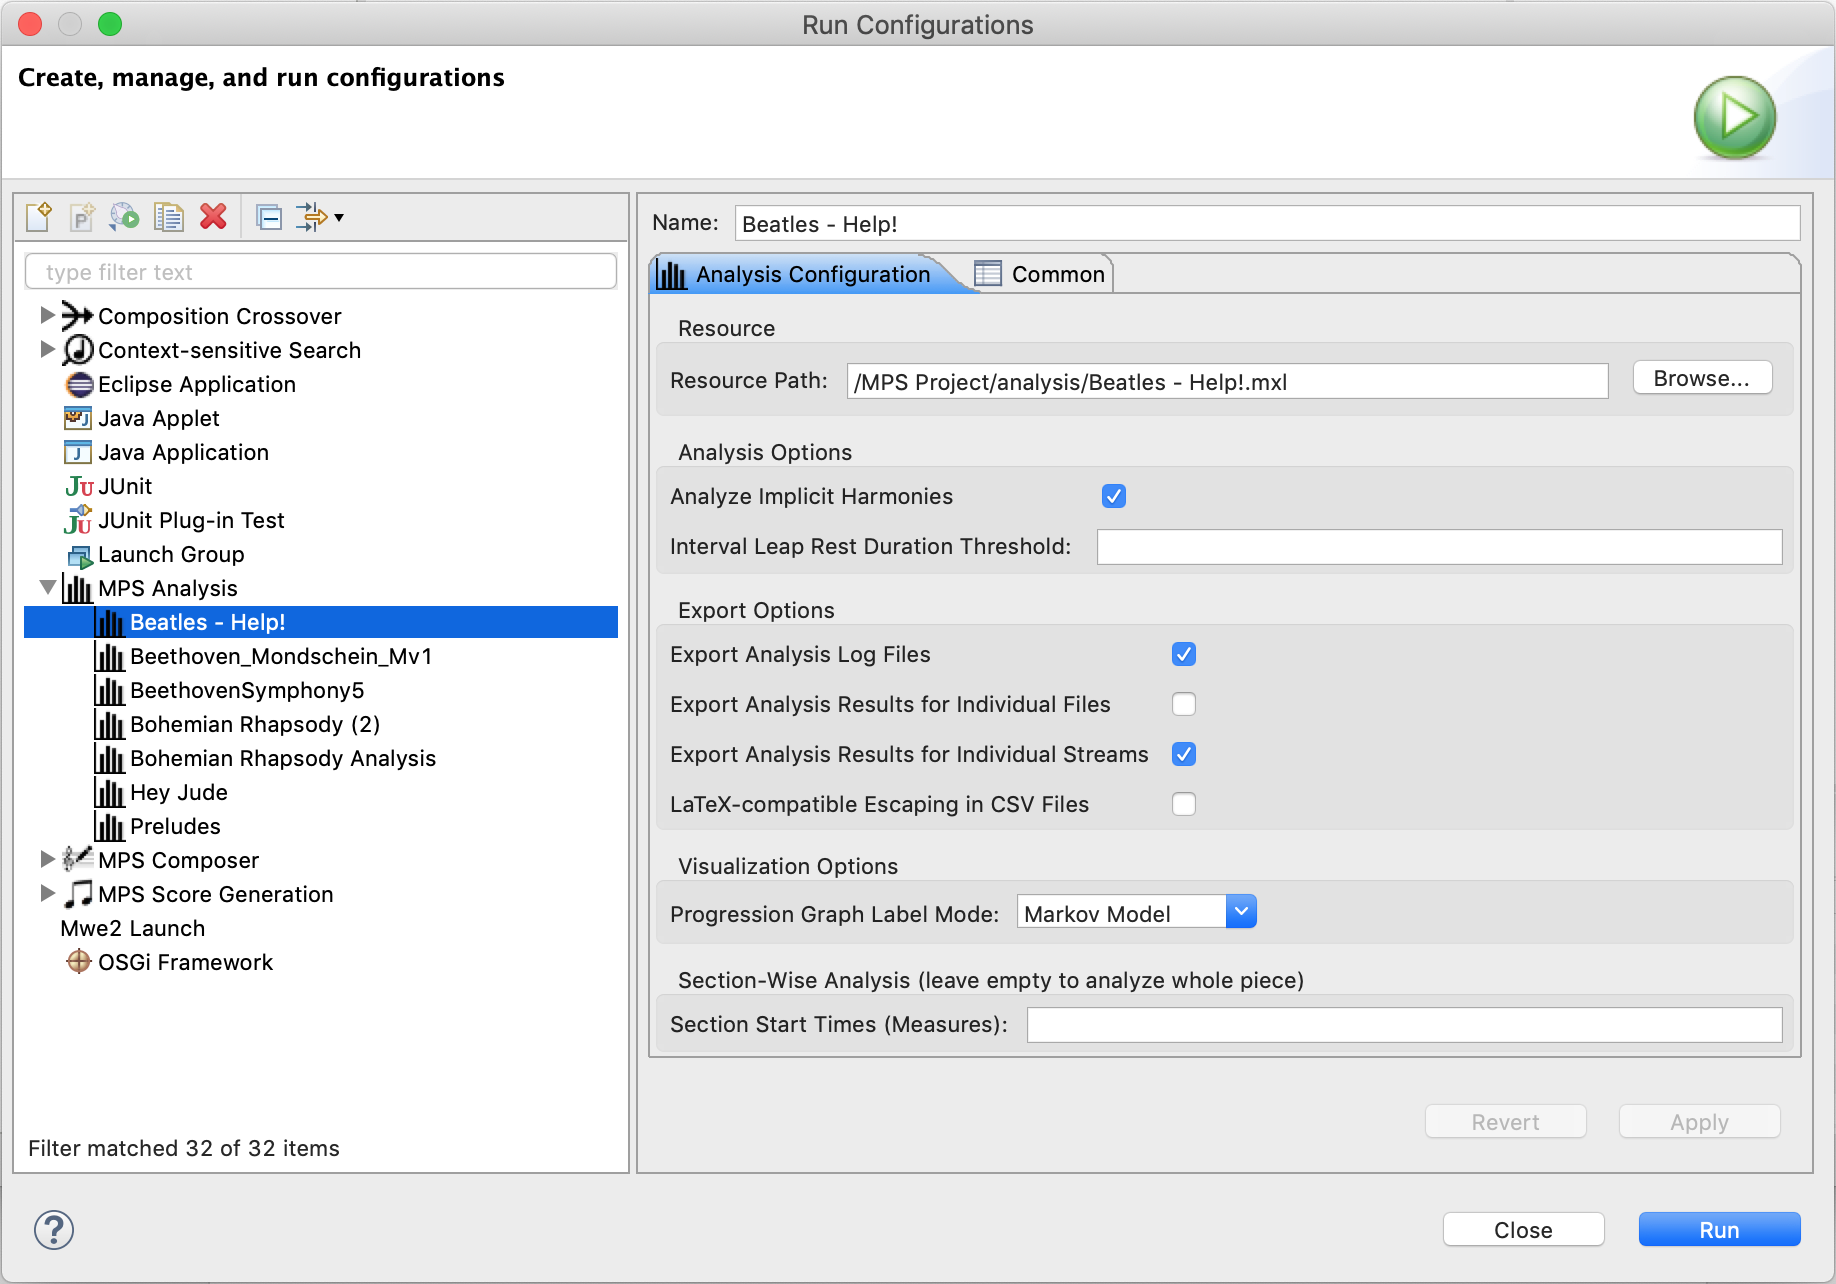
You can either search for an existing run configuration to modify or create a new configuration by clicking the button ![]() . The following parameters can be set:
. The following parameters can be set:
| Parameter | Description |
|---|---|
| Resource Path | Workspace-relative path to a file or folder to be analyzed. |
| Analyze Implicit Harmonies | Attempt to derive harmonies by analyzing simultaneously audible pitches in the piece. |
| Interval Leap Rest Duration Threshold | Specifies the impact of rests between notes for the interval leap detection algorithm. If the value is empty, every rest resets the algorithm, i.e. no interval leaps are detected across rests. In case the value is 0, interval leaps are detected across all rests. If the value is any other positive fraction (e.g. 1/4), the algorithm is reset in case rests longer than the given fraction are detected. |
| Export Analysis Log Files | If enabled, detailed log files are exported. |
| Export Analysis Results for Individual Files | If multiple files are analyzed (collection or corpus scope) and this option is enabled, detailed analysis results for each file are exported. |
| Export Analysis Results for Individual Streams | Indicates whether individual analysis results for each stream (voice) should be exported. |
| Progression Graph Label Mode | Configures how edges in progression graphs (e.g. rhythmic progressions, pitch progressions or harmonic progressions) should be labeled. Occurrence Count displays how often a progression was encountered. Measure Numbers shows the measure number in which the corresponding transition was detected. Markov Model displays the markov model probabilities for each transition. As an example, a harmonic progression graph is shown below with measure number labels. Refer to section Generating Progression Graphs for more details. |
| Section Start Times | Provide a comma-separated list of measure numbers if a single piece should be analyzed section-wise. The first measure does not need to be supplied. Example: 5,17,33. If this field is left empty, the piece is considered to have one large section. |

The figure shows the harmonic progression graph of Ludwig van Beethoven’s Piano Sonata No. 14 in C# minor, first movement. The numbers specify the measures in which the corresponding chord change was detected. The colors of the chords encode the consonance or dissonance of the relevant chord (green corresponds to consonant and red to dissonant). The graph reveals which harmonic progressions are only used once and which are used multiple times. The latter are easily identifiable due to comma-separated enumerations of measure numbers in which the corresponding transitions occur.
Analysis launch configurations can be reused, edited and deleted at any time. Refer to section Launch Configurations for further details.
Analysis results can also be exported in the form of PDF reports. To invoke a report generation, simply select an analysis data folder of your choice and click the button ![]() in the toolbar. Note that you must have a LaTeX environment installed to render analysis reports, which is described in sections LaTeX Installation and LaTeX Configuration in the installation chapter. The PDF will be generated in a directory next the the analysis folder with the name
in the toolbar. Note that you must have a LaTeX environment installed to render analysis reports, which is described in sections LaTeX Installation and LaTeX Configuration in the installation chapter. The PDF will be generated in a directory next the the analysis folder with the name <Analysis Folder Name>_Report.
To configure the contents of analysis report PDFs, navigate the the corresponding preference page:
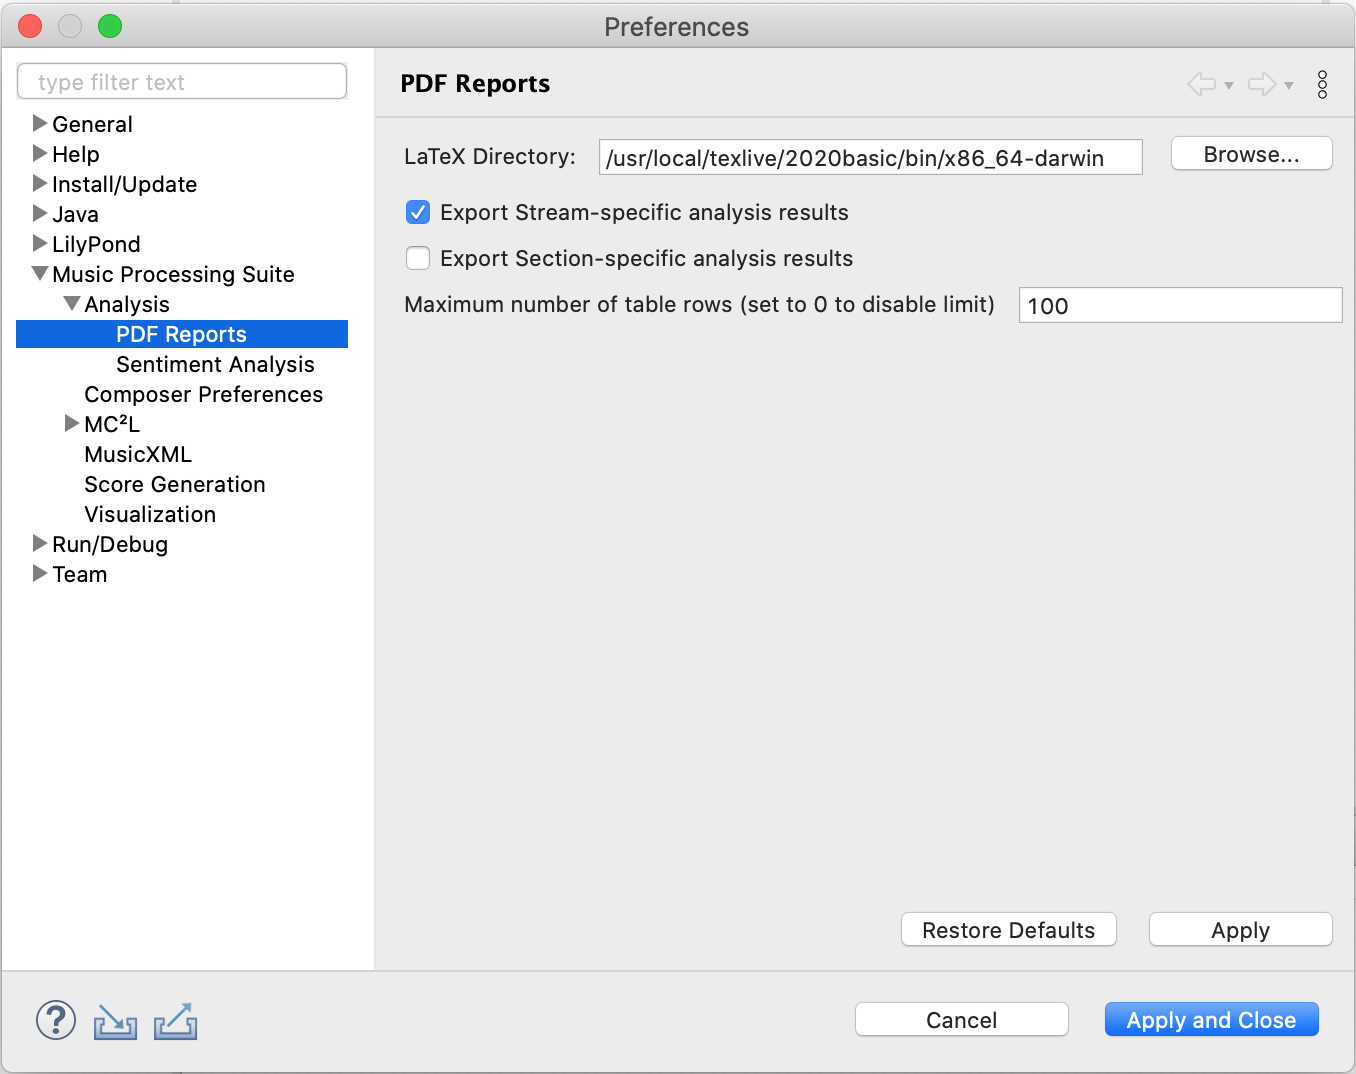
The following settings are available:
| Parameter | Description |
|---|---|
| LaTeX Directory | Path to a LaTeX installation containing the LaTeX executables. |
| Export Stream-specific Results | Configures whether the PDF report should contain analysis results for individual streams. |
| Export Stream-specific Results | If set, the PDF report will contain individual analysis results for each section. This only works if sections were defined and a section-specific analysis was performed. |
| Maximum number of table rows | Sets the maximum number of table rows to be displayed in analysis report PDFs. The default is 100. If set to 0, all rows are printed. |
When analyzing music with MPS, progression graphs of the following musical aspects are generated:
Depending on the setting Progression Graph Label Mode described in the previous section, the edges in the resulting graphs will either have
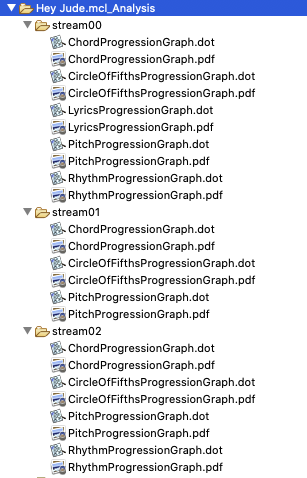
as labels. An example with measure numbers was already presented in the previous section. Here is a harmonic progression graph of Hey Jude by the Beatles with occurrence count labels visualizing how often the corresponding transition was found in the piece:

And this is the same harmonic progression graph as a Markov model with probability labels:

The graphs are exported for each stream separately and can be found in the respective subfolders:
Corresponding PDF files will be generated automatically if GraphViz is installed and configured as described in GraphViz Installation.
If the graphs should be included in analysis report PDF files, the option Export Stream-specific Analysis Results needs to be activated in the preferences as shown in the previous section.
The following table lists all 117 musical features which can be analyzed with MPS.
| Feature | Type | Exported Data |
|---|---|---|
| Total Number of Notes | Number | Total Number of Notes |
| Total Number of Rests | Number | Total Number of Rests |
| Instrument Duration Distribution | Relative Distribution | Instrument, Relative Quantity |
| Note Density | Percentage | Note Density |
| Note Duration Average | Average | Note Duration Average |
| Note Duration Standard Deviation | Standard Deviation | Note Duration Standard Deviation |
| Note Duration Distribution | Relative Distribution | Note Duration, Relative Quantity |
| Note Duration Distribution Dependent on Beat | Relative Distribution | Beat, Note Duration, Relative Quantity |
| Note Duration Distribution Dependent on Beat (Absolute) | Absolute Distribution | Beat, Note Duration, Absolute Quantity |
| Rest Duration Average | Average | Rest Duration Average |
| Rest Duration Standard Deviation | Standard Deviation | Rest Duration Standard Deviation |
| Rest Duration Distribution | Relative Distribution | Rest Duration, Relative Quantity |
| Rest Duration Distribution Dependent on Beat | Relative Distribution | Beat, Rest Duration, Relative Quantity |
| Beat Distribution | Relative Distribution | Beat, Relative Quantity |
| Beat Distribution | Absolute Distribution | Beat, Absolute Quantity |
| Time Signature Distribution | Relative Distribution | Time Signature, Relative Quantity |
| Loudness over Time | Values Over Time | Time, Loudness |
| Loudness over Time | Values Over Time | Measure, Loudness |
| Loudness Distribution | Relative Distribution | Loudness, Relative Quantity |
| Minimum Pitch | String | Minimum Pitch |
| Maximum Pitch | String | Maximum Pitch |
| Minimum Pitch over Time | Values Over Time | Time, Minimum Pitch |
| Minimum Pitch over Time | Values Over Time | Measure, Minimum Pitch |
| Maximum Pitch over Time | Values Over Time | Time, Maximum Pitch |
| Maximum Pitch over Time | Values Over Time | Measure, Maximum Pitch |
| Pitch Distribution | Relative Distribution | Pitch, Relative Quantity |
| Piano Roll | Values Over Time | Time, Pitch, Duration |
| Piano Roll | Values Over Time | Measure, Pitch, Duration |
| Interval Leap Average | Average | Interval Leap Average |
| Interval Leap Standard Deviation | Standard Deviation | Interval Leap Standard Deviation |
| Interval Leap Distribution | Relative Distribution | Interval Leap, Relative Quantity |
| Interval Leap Distribution Dependent on Beat | Relative Distribution | Beat, Interval Leap, Relative Quantity |
| Interval Leaps over Time | Values Over Time | Time, Interval Leap, Absolute Quantity |
| Interval Leaps over Time | Values Over Time | Measure, Interval Leap, Absolute Quantity |
| Number of Simultaneously Audible Notes Average | Average | Number of Simultaneously Audible Notes Average |
| Number of Simultaneously Audible Notes Standard Deviation | Standard Deviation | Number of Simultaneously Audible Notes Standard Deviation |
| Number of Simultaneously Audible Notes Distribution | Relative Distribution | Number of Simultaneously Audible Notes, Relative Quantity |
| Pitch Combination Distribution | Relative Distribution | Pitch Combination, Relative Quantity |
| Pitch Combination Distribution (Absolute) | Absolute Distribution | Pitch Combination, Absolute Quantity |
| Pitch Combination Duration Distribution | Relative Distribution | Pitch Combination, Relative Quantity |
| Pitch Combination Duration Distribution (Absolute) | Absolute Distribution | Pitch Combination, Duration |
| Simultaneously Audible Interval Distribution | Relative Distribution | Interval, Relative Quantity |
| Simultaneously Audible Interval Distribution Dependent on Beat | Relative Distribution | Beat, Interval, Relative Quantity |
| Dissonance Average | Average | Dissonance Average |
| Dissonance Standard Deviation | Standard Deviation | Dissonance Standard Deviation |
| Dissonance Distribution | Relative Distribution | Dissonance, Relative Quantity |
| Dissonance Distribution Dependent on Beat | Relative Distribution | Beat, Dissonance, Relative Quantity |
| Dissonance over Time | Values Over Time | Time, Dissonance |
| Dissonance over Time | Values Over Time | Measure, Dissonance |
| Keys over Time | Values Over Time | Time, Key |
| Keys over Time | Values Over Time | Measure, Key |
| Key Distribution | Relative Distribution | Key, Relative Quantity |
| Circle of Fifths Distance Distribution of Keys | Relative Distribution | Circle of Fifths Distance, Relative Quantity |
| Harmonies over Time | Values Over Time | Time, Harmony |
| Harmonies over Time | Values Over Time | Measure, Harmony |
| Harmony Distribution | Relative Distribution | Harmony, Relative Quantity |
| Harmony Distribution (Simplified) | Relative Distribution | Harmony, Relative Quantity |
| Chord Inversion Distribution | Relative Distribution | Inversion, Relative Quantity |
| Harmony Change Beat Distribution | Relative Distribution | Beat, Relative Quantity |
| Harmony Duration Distribution | Relative Distribution | Harmony Duration, Relative Quantity |
| Circle of Fifths Distance Distribution of Harmonies | Relative Distribution | Circle of Fifths Distance, Relative Quantity |
| Harmony Distribution Dependent on Beat | Relative Distribution | Beat, Harmony, Relative Quantity |
| Harmony Distribution Dependent on Duration | Relative Distribution | Harmony Duration, Harmony, Relative Quantity |
| Implicit Harmonies over Time | Values Over Time | Time, Implicit Harmony, Inversion, Pitch Combination |
| Implicit Harmonies over Time (Simplified) | Values Over Time | Time, Implicit Harmony, Inversion, Pitch Combination |
| Implicit Harmonies over Time | Values Over Time | Measure, Implicit Harmony, Inversion, Pitch Combination |
| Implicit Harmonies over Time (Simplified) | Values Over Time | Measure, Implicit Harmony, Inversion, Pitch Combination |
| Implicit Harmony Distribution | Relative Distribution | Implicit Harmony, Relative Quantity |
| Implicit Harmony Distribution (Simplified) | Relative Distribution | Implicit Harmony, Relative Quantity |
| Harmony Change Beat Distribution (Simplified) | Relative Distribution | Beat, Relative Quantity |
| Implicit Harmony Duration Distribution | Relative Distribution | Harmony Duration, Relative Quantity |
| Circle of Fifths Distance Distribution of Implicit Harmonies | Relative Distribution | Circle of Fifths Distance, Relative Quantity |
| Implicit Harmony Distribution Dependent on Beat | Relative Distribution | Beat, Implicit Harmony, Relative Quantity |
| Implicit Harmony Distribution Dependent on Beat (Simplified) | Relative Distribution | Beat, Implicit Harmony, Relative Quantity |
| Implicit Harmony Distribution Dependent on Duration | Relative Distribution | Harmony Duration, Implicit Harmony, Relative Quantity |
| Implicit Harmony Distribution Dependent on Duration (Simplified) | Relative Distribution | Harmony Duration, Implicit Harmony, Relative Quantity |
| Harmony Analysis over Time | Values Over Time | Time, Key, Harmony, Roman Numeral (Classical), Roman Numeral (Pop/Jazz) |
| Harmony Analysis over Time | Values Over Time | Measure, Key, Harmony, Roman Numeral (Classical), Roman Numeral (Pop/Jazz) |
| Chord Compliance | Percentage | Chord Compliance |
| Root Note Compliance | Percentage | Root Note Compliance |
| Bass Note Compliance | Percentage | Bass Note Compliance |
| Scale Compliance Relative to Key | Percentage | Scale Compliance Relative to Key |
| Scale Compliance Relative to Harmony | Percentage | Scale Compliance Relative to Harmony |
| Syllable Distribution | Relative Distribution | Syllable, Relative Quantity |
| Words over Time | Values Over Time | Start Time, End Time, Word |
| Words over Time | Values Over Time | Start Measure, End Measure, Word |
| Word Distribution | Relative Distribution | Word, Relative Quantity |
| Sentence Parts over Time | Values Over Time | Start Time, End Time, Sentence Part |
| Sentence Parts over Time | Values Over Time | Start Measure, End Measure, Sentence Part |
| Sentences over Time | Values Over Time | Start Time, End Time, Sentence |
| Sentences over Time | Values Over Time | Start Measure, End Measure, Sentence |
| Sentence Sentiment Polarity over Time | Values Over Time | Start Time, End Time, Sentence, Compound Polarity, Very Negative Polarity, Negative Polarity, Neutral Polarity, Positive Polarity, Very Positive Polarity |
| Sentence Sentiment Polarity over Time | Values Over Time | Start Measure, End Measure, Sentence, Compound Polarity, Very Negative Polarity, Negative Polarity, Neutral Polarity, Positive Polarity, Very Positive Polarity |
| Aggregated Note Duration Distribution | Aggregated Relative Distribution | Note Duration, Relative Quantity |
| Aggregated Rest Duration Distribution | Aggregated Relative Distribution | Rest Duration, Relative Quantity |
| Aggregated Note Duration Distribution Dependent on Beat | Aggregated Relative Distribution | Beat, Note Duration, Relative Quantity |
| Aggregated Beat Distribution | Aggregated Relative Distribution | Beat, Relative Quantity |
| Aggregated Pitch Distribution | Aggregated Relative Distribution | Pitch, Relative Quantity |
| Aggregated Interval Leap Distribution | Aggregated Relative Distribution | Interval Leap, Relative Quantity |
| Aggregated Interval Leap Distribution Dependent on Beat | Aggregated Relative Distribution | Beat, Interval Leap, Relative Quantity |
| Aggregated Dissonance Distribution | Aggregated Relative Distribution | Dissonance, Relative Quantity |
| Aggregated Dissonance Distribution Dependent on Beat | Aggregated Relative Distribution | Beat, Dissonance, Relative Quantity |
| Aggregated Simultaneously Audible Interval Distribution | Aggregated Relative Distribution | Interval, Relative Quantity |
| Aggregated Simultaneously Audible Interval Distribution Dependent on Beat | Aggregated Relative Distribution | Beat, Interval, Relative Quantity |
| Aggregated Time Signature Distribution | Aggregated Relative Distribution | Time Signature, Relative Quantity |
| Aggregated Key Distribution | Aggregated Relative Distribution | Key, Relative Quantity |
| Aggregated Harmony Distribution | Aggregated Relative Distribution | Harmony, Relative Quantity |
| Aggregated Simplified Harmony Distribution | Aggregated Relative Distribution | Harmony, Relative Quantity |
| Aggregated Implicit Harmony Distribution | Aggregated Relative Distribution | Implicit Harmony, Relative Quantity |
| Aggregated Simplified Implicit Harmony Distribution | Aggregated Relative Distribution | Implicit Harmony, Relative Quantity |
| Aggregated Harmony Duration Distribution | Aggregated Relative Distribution | Harmony Duration, Relative Quantity |
| Aggregated Harmony Change Beat Distribution | Aggregated Relative Distribution | Beat, Relative Quantity |
| Aggregated Harmony Distribution Dependent on Beat | Aggregated Relative Distribution | Beat, Harmony, Relative Quantity |
| Aggregated Harmony Distribution Dependent on Duration | Aggregated Relative Distribution | Duration, Harmony, Relative Quantity |
| Aggregated Circle of Fifths Distance Distribution of Keys | Aggregated Relative Distribution | Circle of Fifths Distance, Relative Quantity |
| Aggregated Circle of Fifths Distance Distribution of Harmonies | Aggregated Relative Distribution | Circle of Fifths Distance, Relative Quantity |
| Aggregated Circle of Fifths Distance Distribution of Implicit Harmonies | Aggregated Relative Distribution | Circle of Fifths Distance, Relative Quantity |
| Previous | Top | Next |
| Context-sensitive Search | Algorithmic Composition |