Music Processing Suite provides an extensive music analysis component for statistical musicological analyses. It is possible to perform
- in-depth analyses of a specific piece
- comparative analyses of a collection of pieces
- comparative analyses of a large corpus of compositions
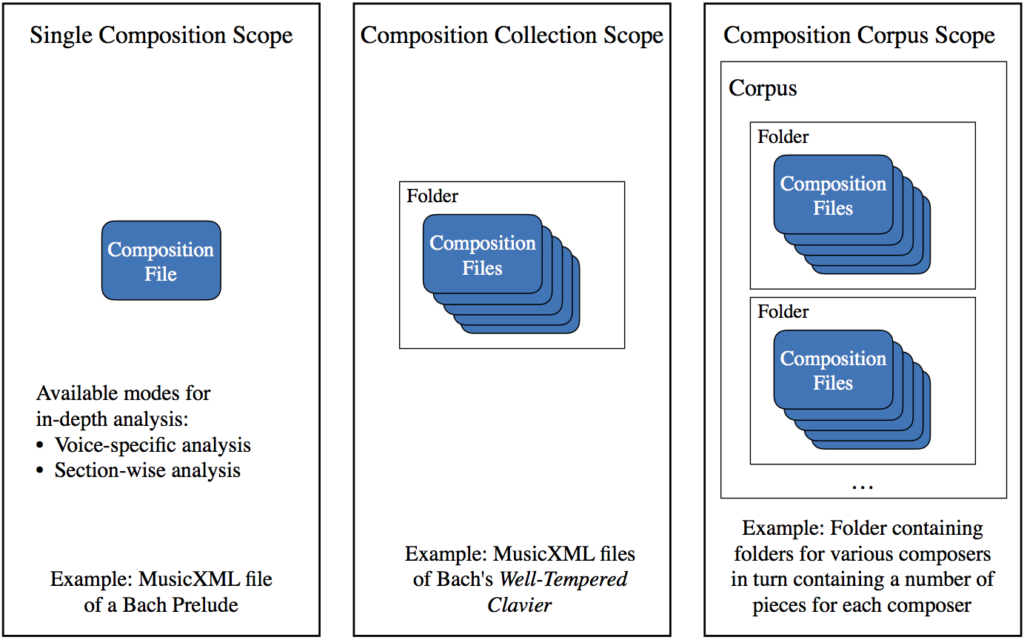
The different analysis scopes are visualized in the following figure:
MPS produces CSV files containing statistical analysis data of the compositions selected in the analysis scope. These can be used for scientific analysis purposes and can be visualized in the form of charts and plots directly in the MPS application. Furthermore, PDF reports can be generated containing high-quality plots, diagrams and graphs visualizing the data.
Single Piece Scope
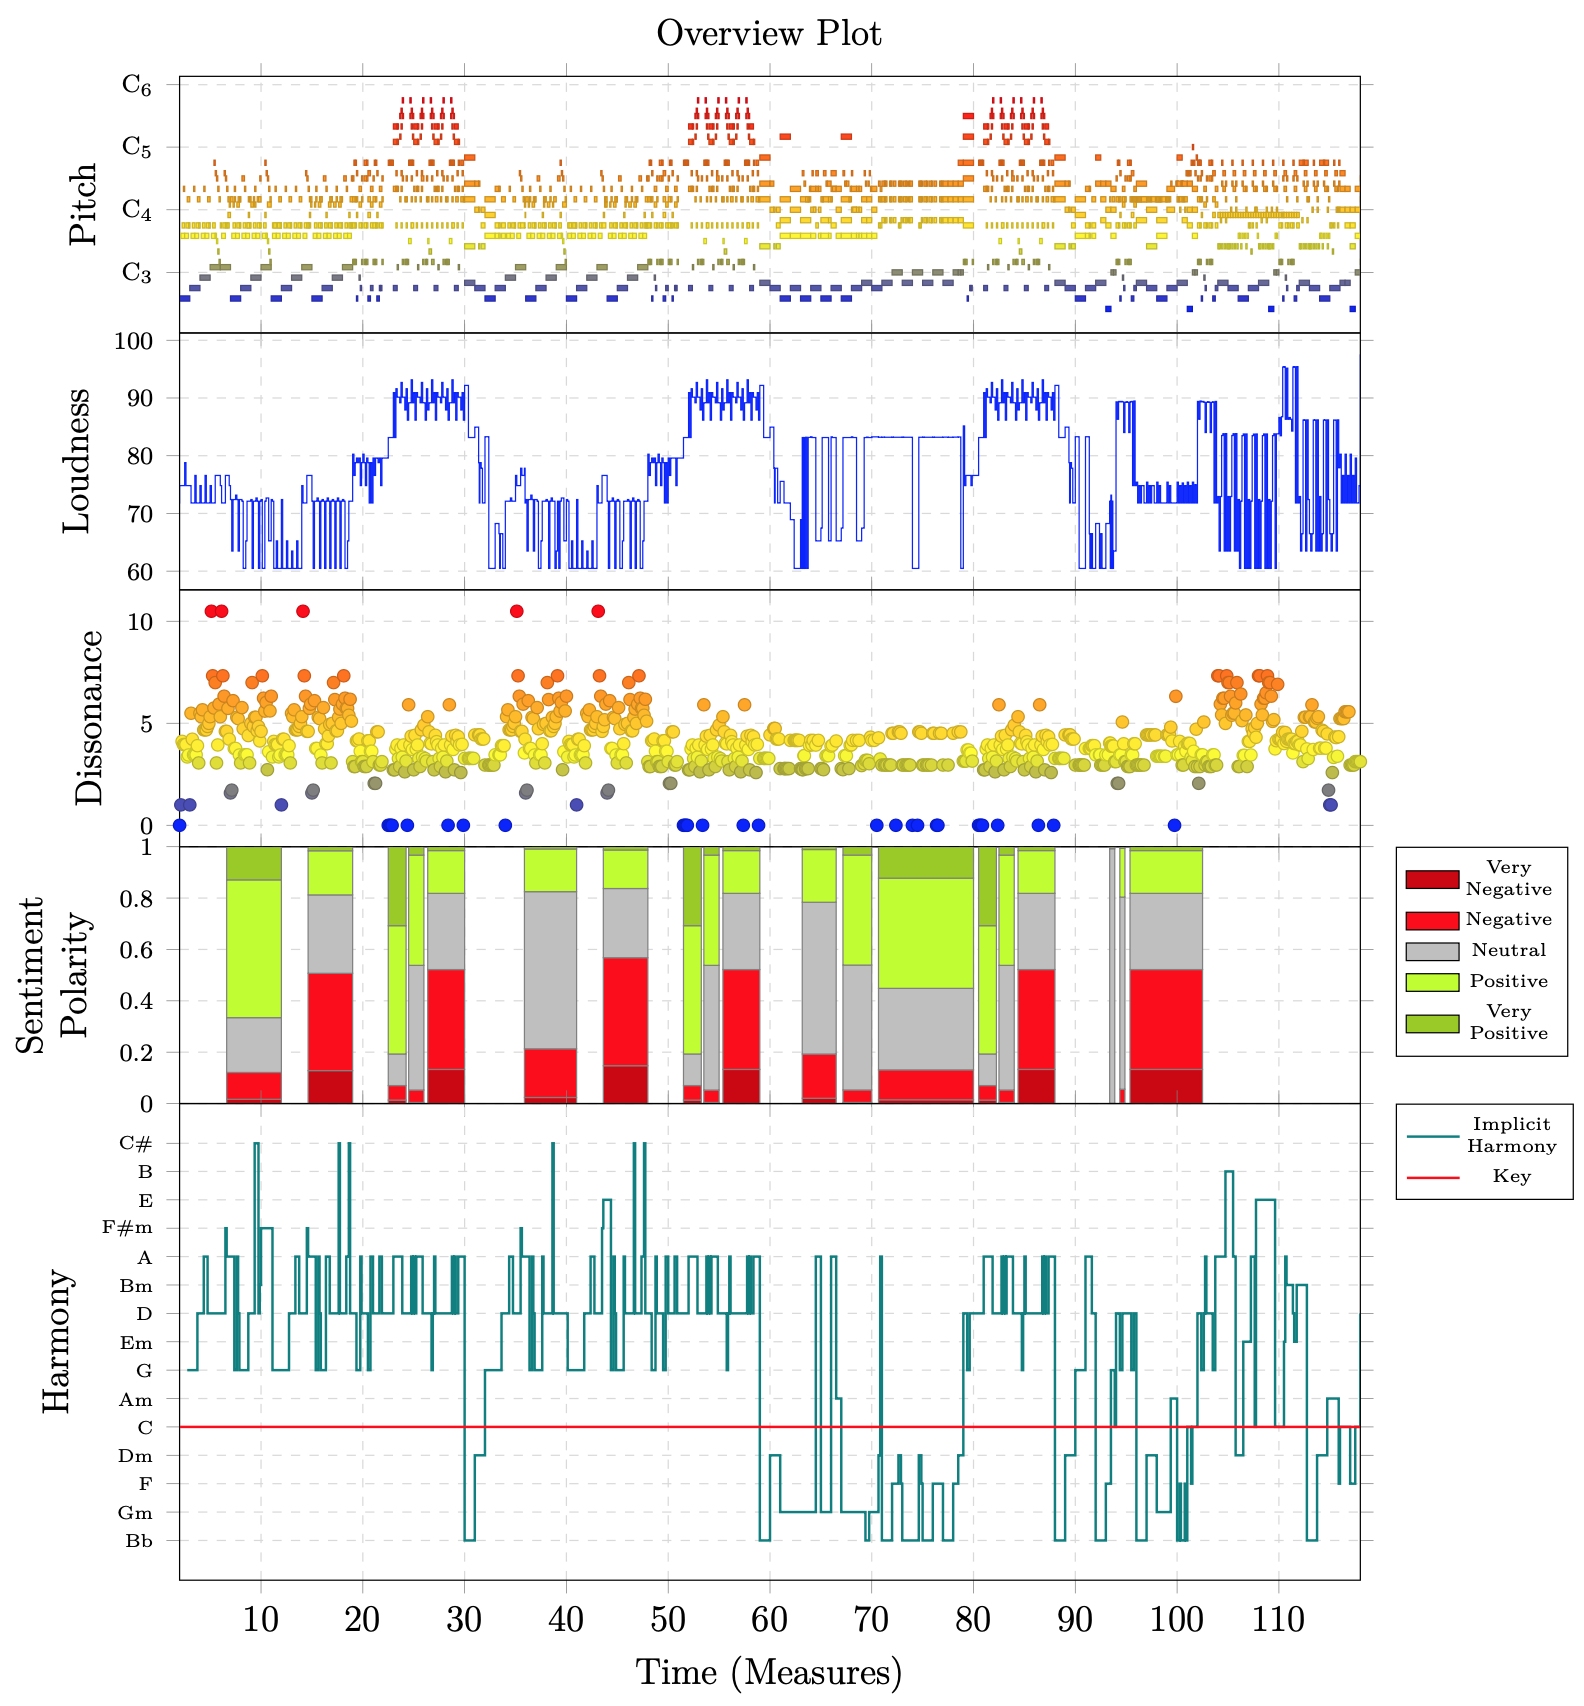
With MPS it is possible to analyze rhythms, time signatures, loudness, pitches, interval leaps, pitch combinations, dissonance, harmonies, chords and lyrics of musical pieces, among other parameters. The following example visualizes pitches, loudness, dissonance, sentiment polarity and harmonies over time for Every Little Thing She Does is Magic by the Police:
The following examples visualize analyis data of Beethoven’s Piano Sonata No. 14 in C♯ minor, Op. 27, No. 2.
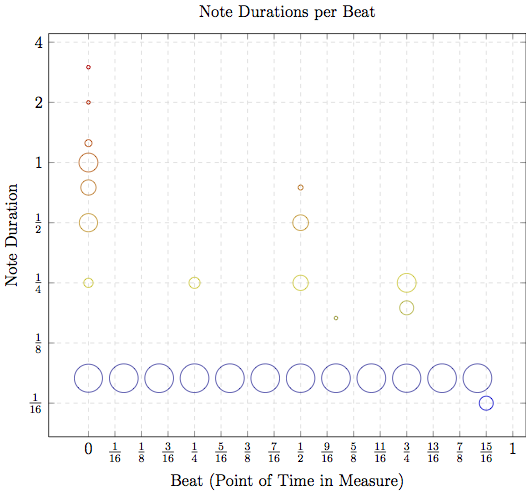
Distribution of note durations dependent on the corresponding beat (point of time in the respective measure)
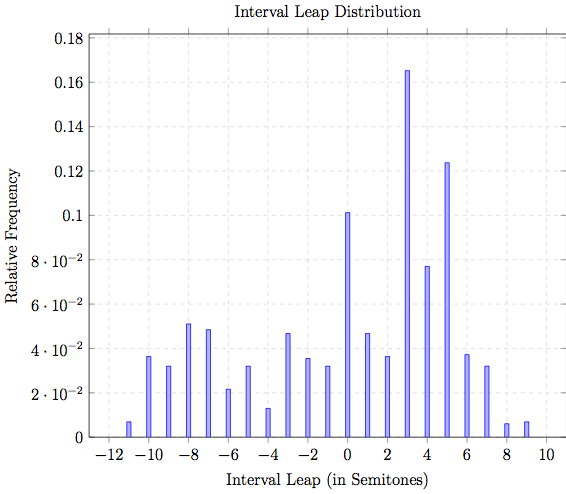
Histogram visualizing interval leaps of successive notes
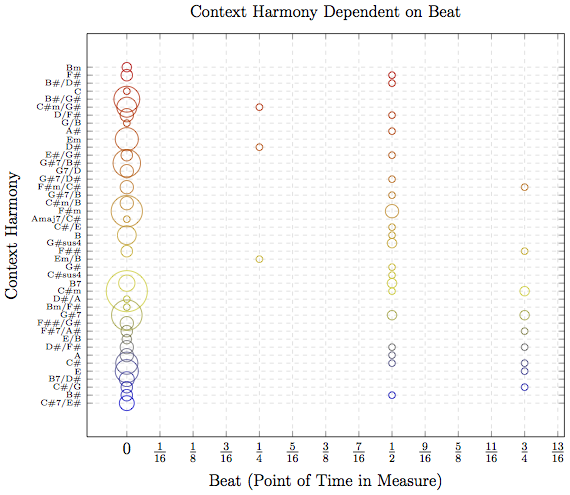
Distribution of harmonies dependent on initial beat (point of time in the respective measure)
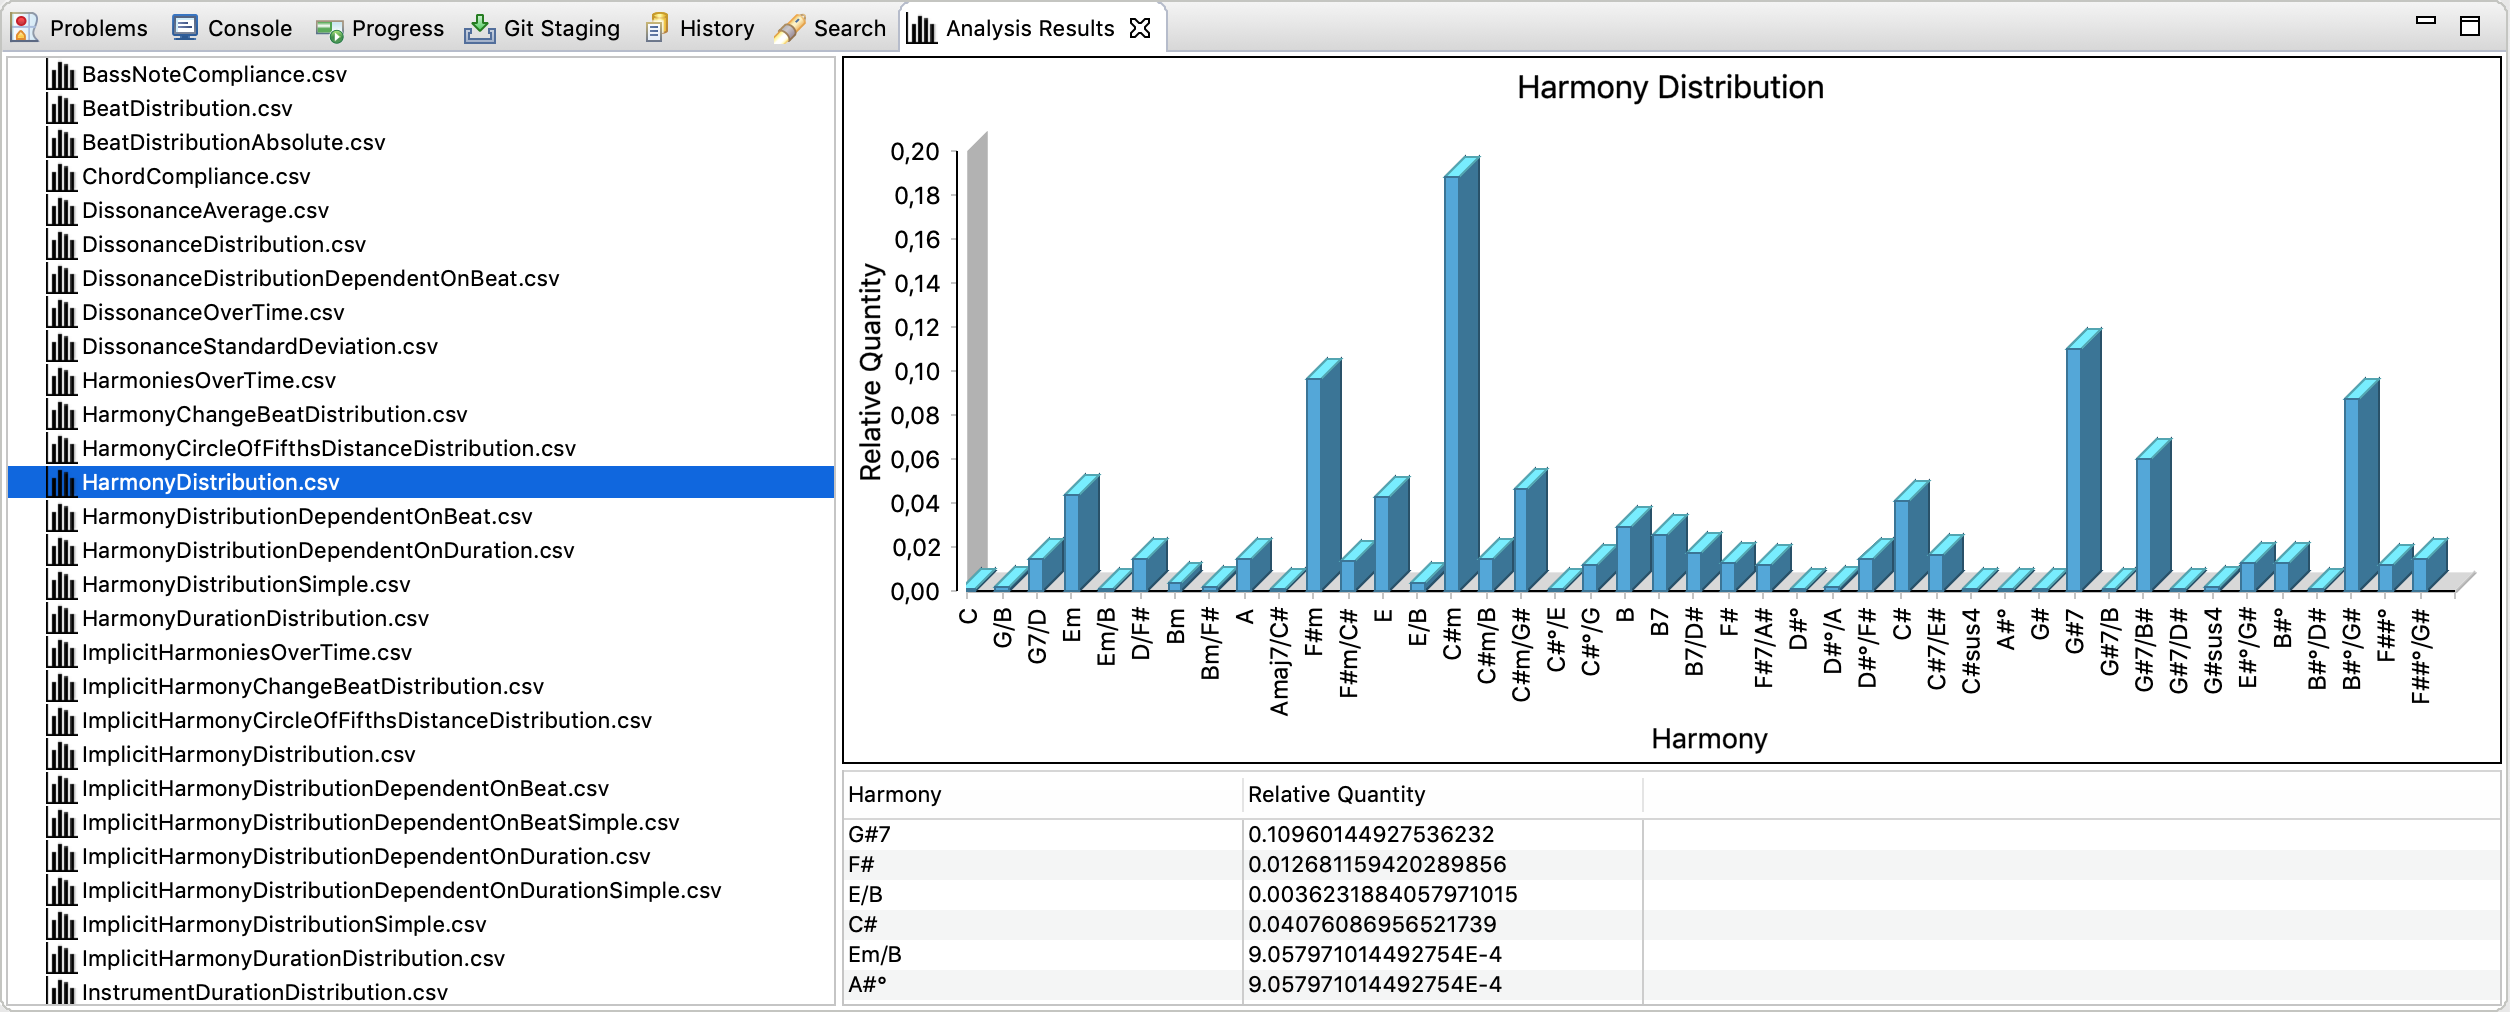
Analysis Results View visualizing the harmony distribution of Beethoven’s Piano Sonata No. 14 in C♯ minor, Op. 27, No. 2
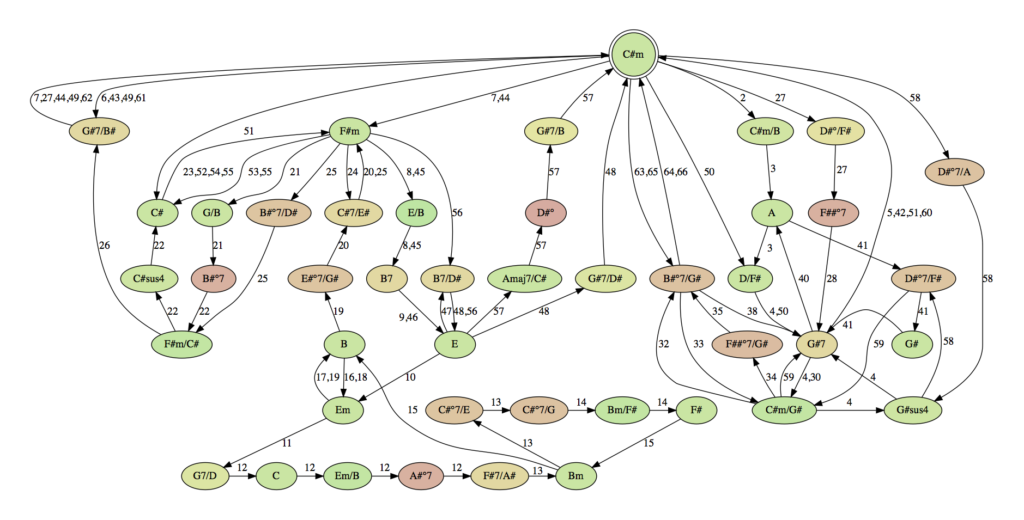
Harmonic progression graph visualizing the measure numbers of the respective harmonic transitions (edge labels, black) and the consonance/dissonance of the respective harmonies (green: consonant, red: dissonant)
It is also possible to generate Markov model representations of specific musical context layers, such as rhythmic, tonal and harmonic progessions. The following graph shows a Markov model of the harmonic progressions in Yesterday by the Beatles:
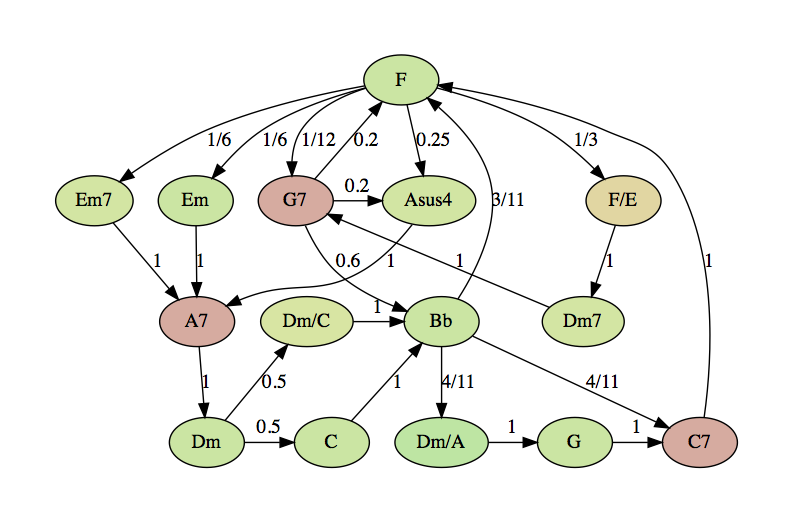
Markov model of harmonic progressions in Yesterday by the Beatles
Composition Collection Scope
The following diagram visualizes the distribution of keys in J.S. Bach’s Well-Tempered Clavier Preludes (Book I):
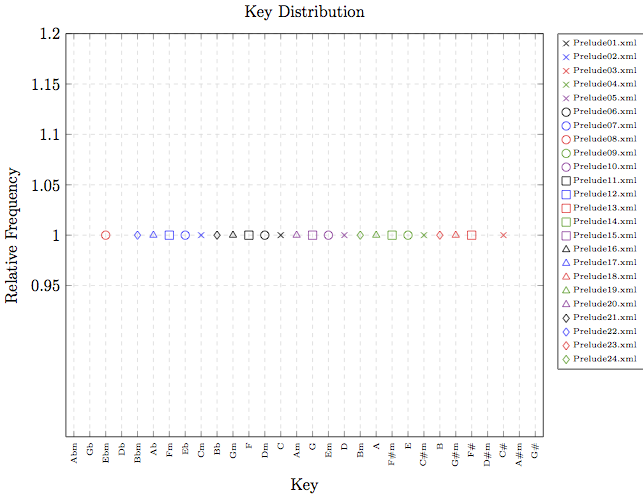
Distribution of keys in J.S. Bach’s Well-Tempered Clavier Preludes (Book I)
Corpus Scope
This plot shows aggregated interval leap distributions for a large corpus (over 1000 compositions) by various composers:
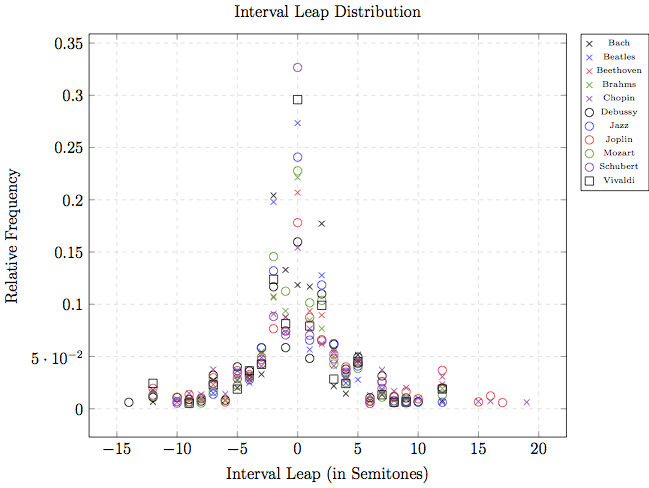
Aggregated interval leap distribution histograms
Learn more about analysis functionality and parameters in the documentation.